


 Started last week with a lot of ginger to keep learning and complete my assigned tasks but damn the work is a lot, I'm not going to lie 💆♀. Remember I ended last week’s gist telling you of the work load ahead of me, you've not read it? 😒 nawa oh, check here. Back to todays gist, well your girl was overwhelmed a bit because it looked like the tasks wouldn’t finish and I saw small shege in the hand of one bug like this😰, but google and stack overflow held my hand to go past it, ‘bug got nothing on me💃’.
To the tasks for the week, well, just a part of it😉. I worked on a COVID dataset, got the data from Ourworldindata and used SQL server for my analysis and tableau for my visualization.
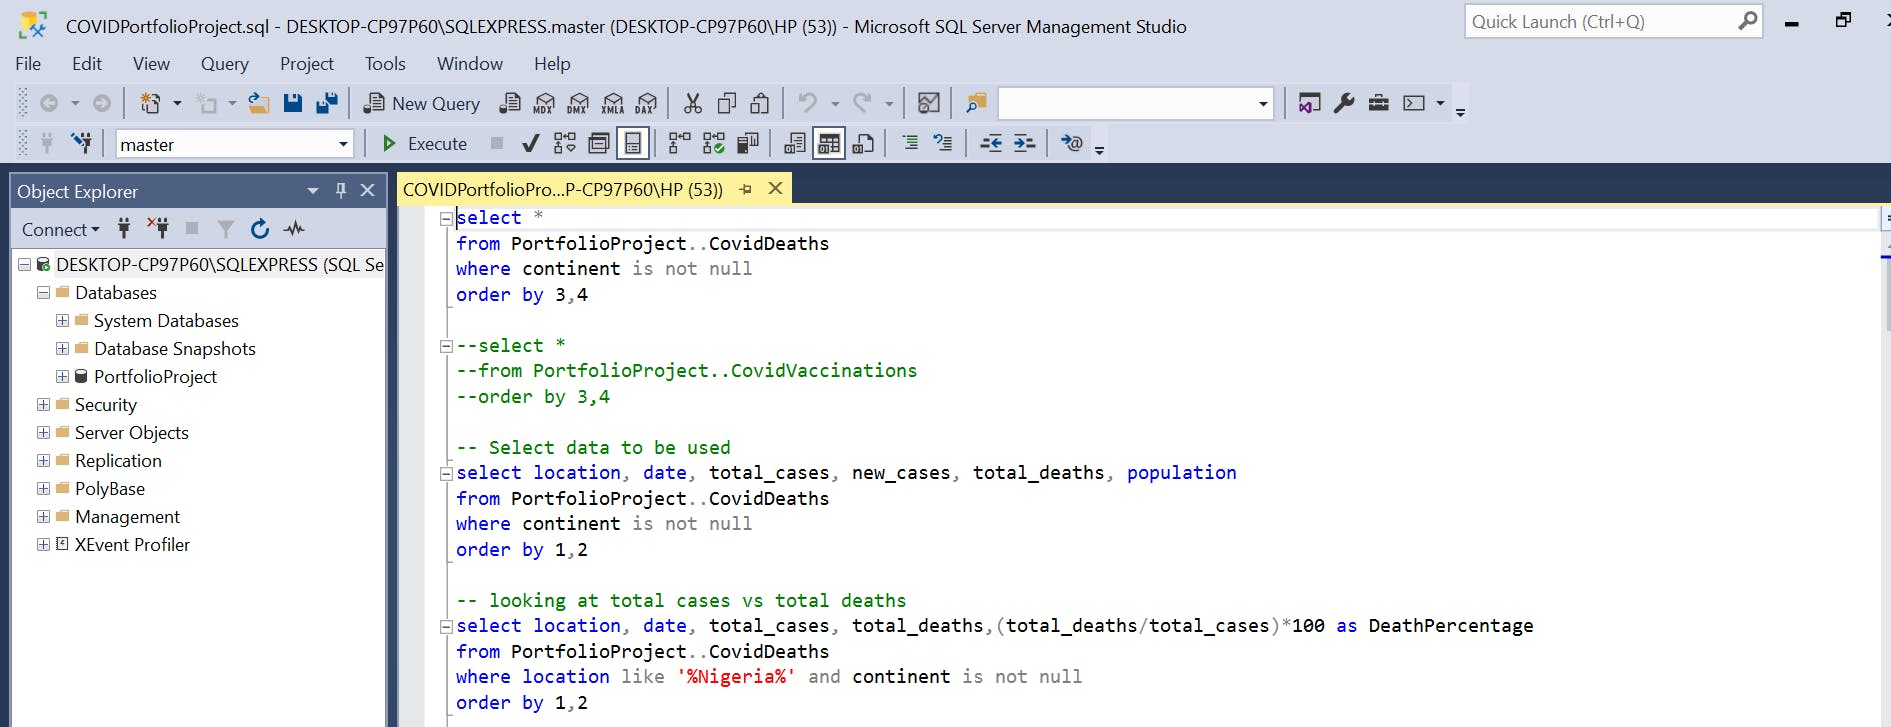 Follow the SQL analysis here. While working on the dataset, I got a better understanding of using sql join,using CAST and CTE (common table expression). I also stumbled on ‘bigint’ for large dataset when working with ‘cast’.
Moving on to visualization with Tableau, I created a dashboard which I tried to make live. Interacting with the dashboard is easy, try playing around the percentage population infected graph, by checking for other countries other than the ones currently specified on the graph. It was also a good learning experience using the forecast and geographic role function.
So far, consistency is making my learning curve easier, thanks to rollademymentorship pressing my neck with tasks😑, check-ins, and encouraging words to keep pushing😊.
I’ll keep you posted on how the rest of my task goes and how I am navigating my data journey. 🤫 Hey come closer, I joined a team to work on datathon for Datafest as the only female team member. Trust me to tell you how that goes.
Till later, cheers🙋♀.